What the USDA Zone Map Actually Tells You
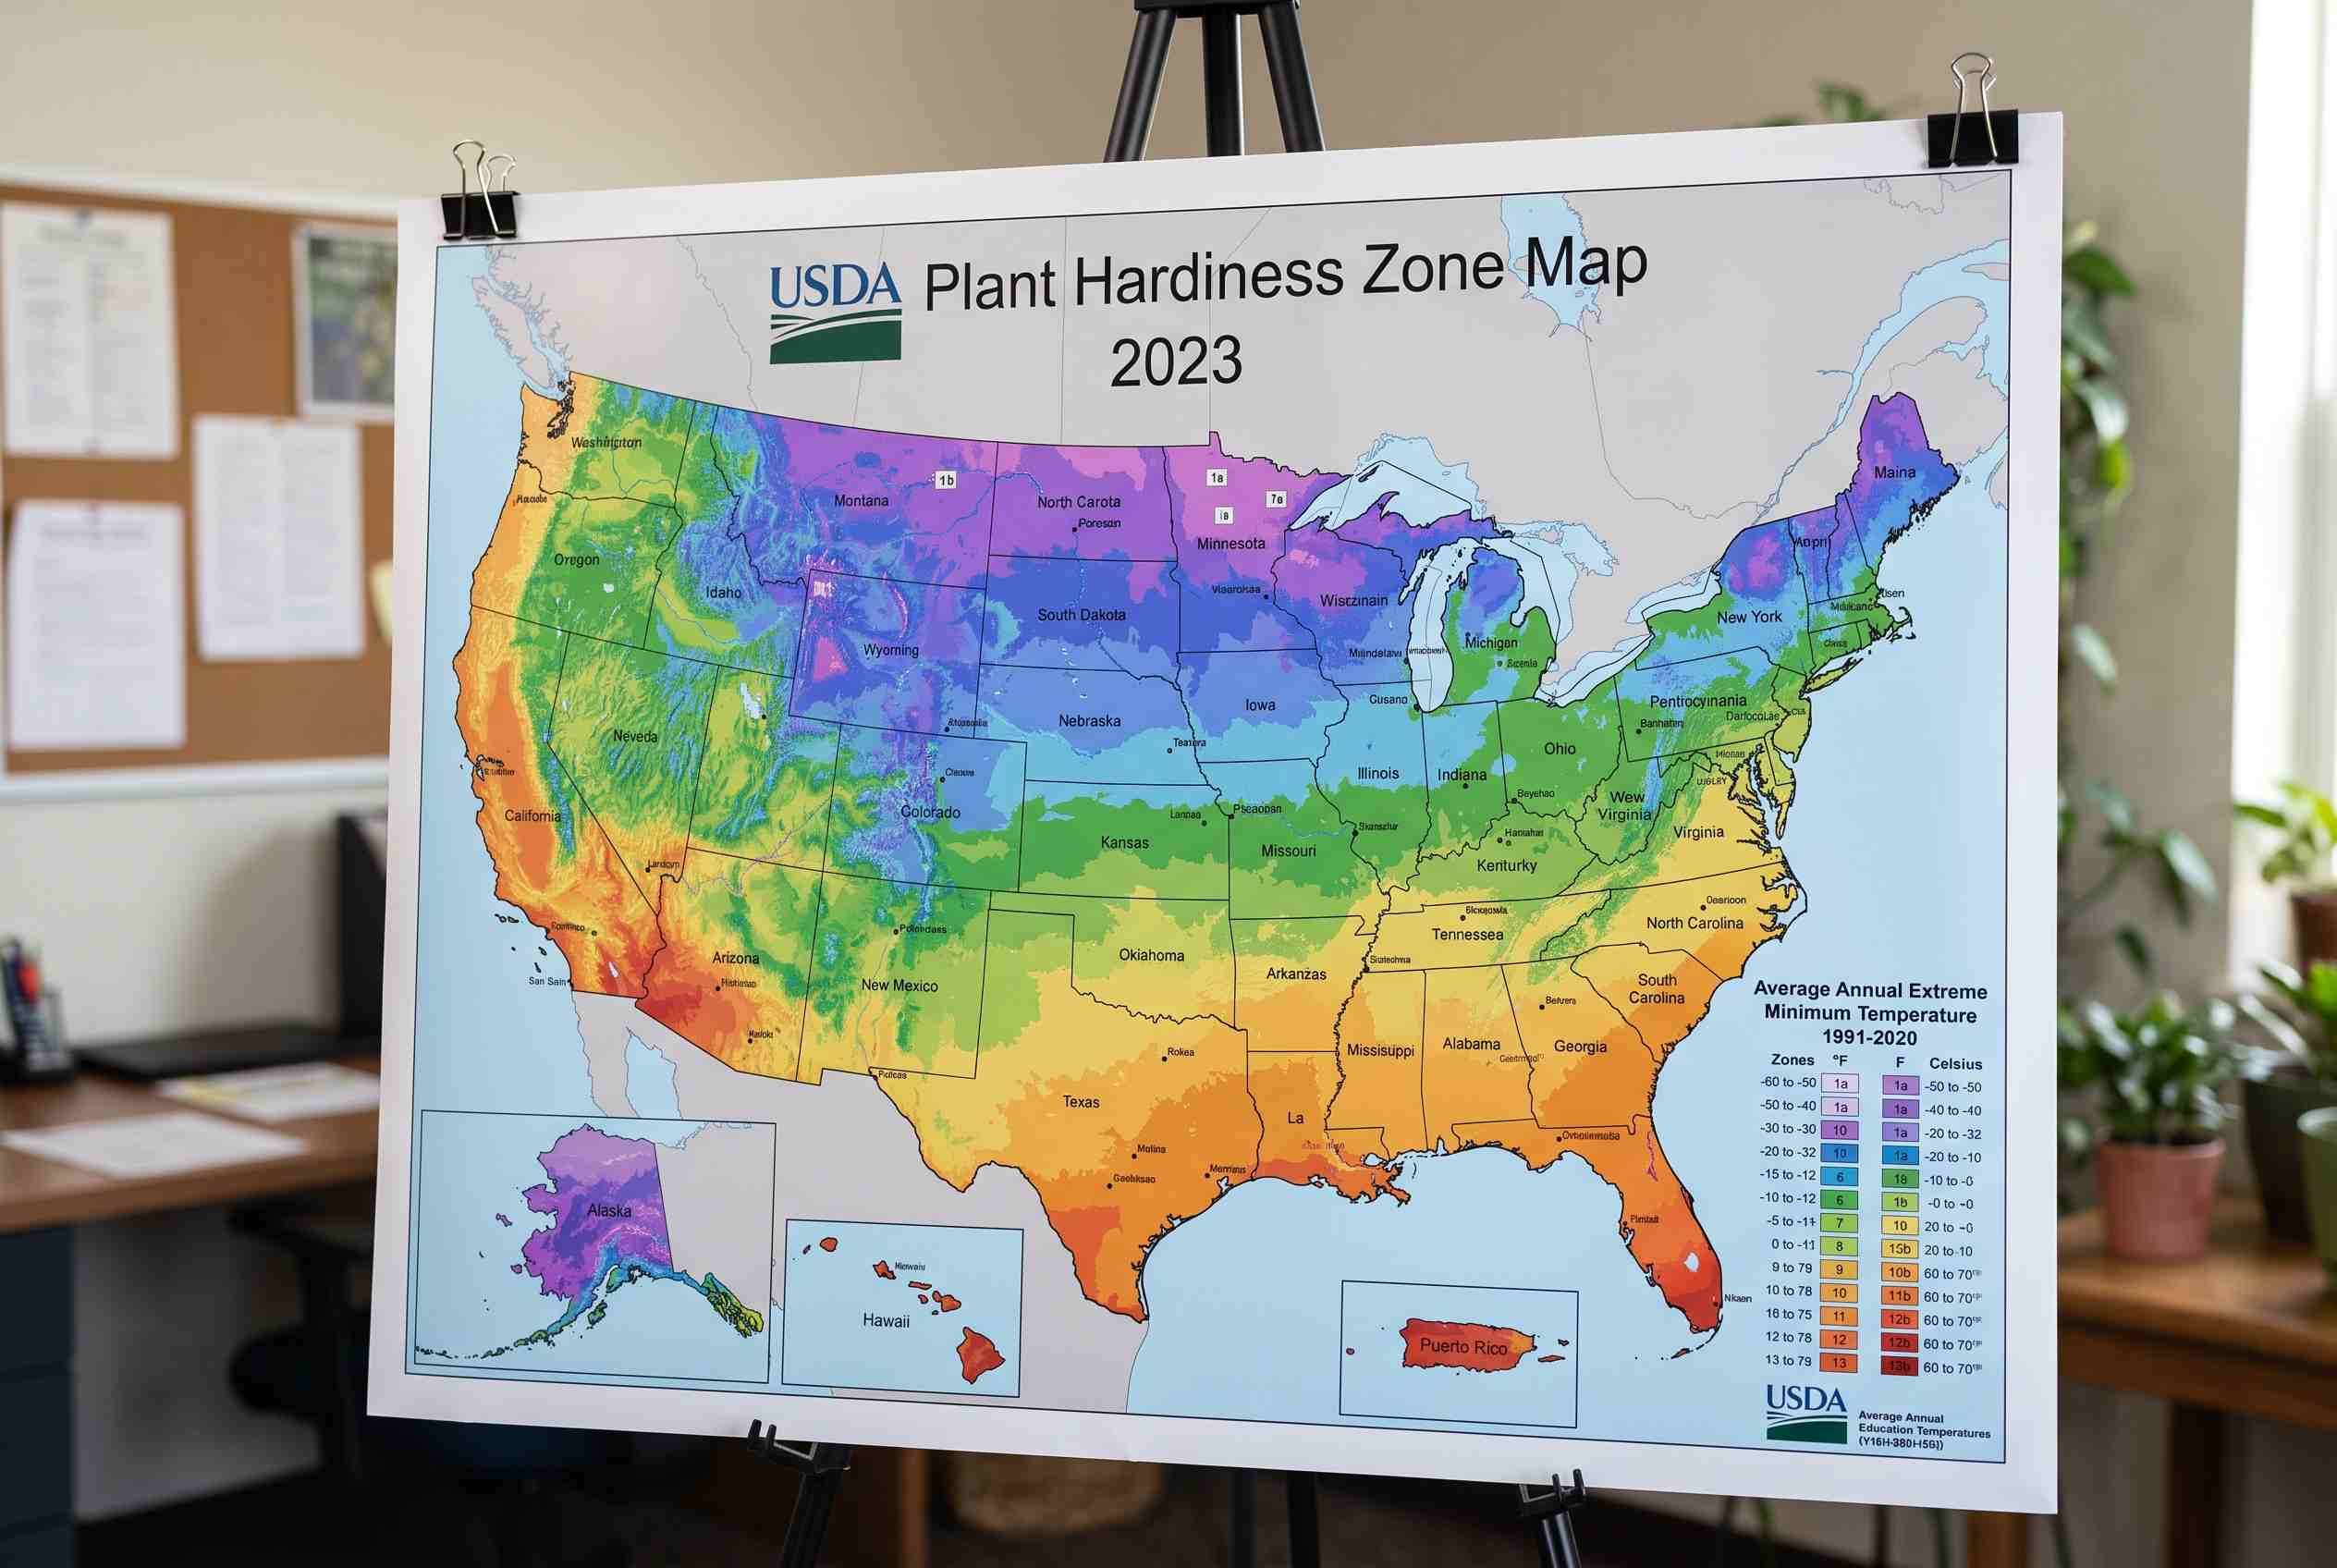
If you’ve ever picked up a plant tag at a nursery and seen a little number range like “Zones 5–8,” that’s a direct reference to the USDA zone map. The USDA zone map, officially called the USDA Plant Hardiness Zone Map, divides North America into zones based on the average lowest winter temperature in a given area. It’s not about heat, rainfall, or soil — it’s purely about how cold it gets where you live, and whether a plant can survive that cold without dying back to the roots. The USDA Agricultural Research Service maintains the official, interactive version of the map online, and it’s free to search by zip code.
Why the USDA Zone Map Matters Before You Plant Anything
A lot of gardening disappointment comes down to one simple mistake: buying a plant that was never going to make it through winter in your area. The USDA zone map exists to prevent exactly that. Each zone represents a 10-degree Fahrenheit band of average minimum winter temperature, and zones are further split into “a” and “b” sub-zones for 5-degree precision. So when a seed packet or plant label says “hardy to Zone 6,” that’s telling you, based on the USDA zone map, the coldest conditions that plant can reliably survive. Skip checking it, and you risk losing perennials, shrubs, or fruit trees to the first hard freeze.
How to Find Your Zone on the USDA Zone Map
Finding your spot on the USDA zone map is simple. Head to the official interactive map, type in your zip code, and it’ll return your specific zone — something like “7a” or “9b.” If you’d rather browse visually, the map is color-coded by region, so you can see at a glance how zones shift as you move from the coast inland or climb in elevation. Keep in mind the USDA zone map was last significantly updated in 2023, and many areas shifted slightly warmer compared to the older 2012 edition, largely reflecting newer, more complete weather station data. If you’re working from an old plant tag or a gardening book from a decade ago, it’s worth double-checking your zone against the current version rather than trusting memory.
Reading Zone Numbers Without Overthinking Them
The number itself is simple once you see the logic. Zone 1 is the coldest (parts of interior Alaska), and Zone 13 is the warmest (tropical Puerto Rico and Hawaii). Most of the continental U.S. falls somewhere between Zone 3 and Zone 10. If your result from the USDA zone map says “Zone 6b,” the “6” tells you the general 10-degree band, and the “b” narrows it to the warmer half of that band. You don’t need to memorize exact temperatures — just remember that a lower number means colder winters, and a higher number means milder ones. This is the piece of the USDA zone map most people actually need day to day.
What the USDA Zone Map Doesn’t Tell You
It’s worth being honest about the limits here. The USDA zone map only measures winter cold — it says nothing about summer heat, humidity, rainfall, soil type, or how many hours of sun a spot gets. Two gardens in the same zone can have completely different growing conditions. A desert garden in Zone 8 and a humid coastal garden in Zone 8 will support very different plants, even though both check out fine on the USDA zone map. If heat tolerance matters to you, it’s worth pairing the USDA zone map with the American Horticultural Society’s Heat Zone Map, which rates regions by the number of days above 86°F each year.
Using the USDA Zone Map When You Shop for Plants
Nurseries, seed catalogs, and online garden shops almost always list a hardiness range pulled straight from the USDA zone map. When you see “Zones 4–9” on a plant description, that means it’ll survive winters as cold as Zone 4 and tolerate the milder winters up through Zone 9 — but that upper number isn’t a heat guarantee, it just means the plant won’t need extra winter protection in that range either. A smart habit is to check your zone once, write it down somewhere you’ll remember (a note on your phone works fine), and reference it every time you’re about to buy something new. It saves money and heartbreak compared to guessing.
Microclimates Can Shift Your Real-World Zone
One thing seasoned gardeners learn fast: your official zone from the USDA zone map is a regional average, not a guarantee for every square foot of your yard. A spot against a south-facing brick wall can run noticeably warmer than the open middle of your lawn. Low-lying areas where cold air pools can run colder than your assigned zone would suggest. Urban areas tend to run slightly warmer than their surrounding countryside due to the heat retained by pavement and buildings — a phenomenon climate researchers at NOAA have documented extensively. None of this means the USDA zone map is wrong; it just means treat it as your starting point, then adjust based on what you observe in your own space over a season or two.
The Bottom Line
The USDA zone map is one of the simplest, most useful tools in gardening — a quick zip code search tells you which plants have a real shot at surviving your winters. It won’t account for every variable in your yard, but it removes the guesswork on the one factor that kills more plants than anything else: cold they weren’t built to handle. Check your zone, keep it in mind every time you shop for plants, and you’ll avoid the most common and most frustrating gardening mistake there is.